Do Infectious Disease Mortality Graphs Show Vaccines Save Lives?
Source of above quote: Dr Blaylock’s article HERE
Vaccination advocates claim that “vaccines save lives”, or that “vaccines have saved millions of lives”.
Their claims conflict with statements by authors and researchers who have actually looked at the evidence.
Do You Want to Remain Informed about the Latest Vaccine News?

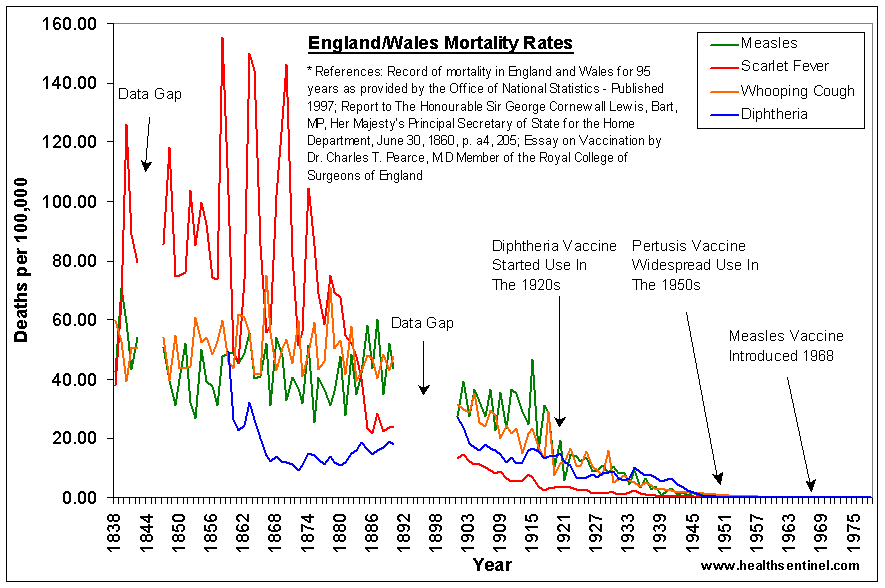
“The combined death rate from scarlet fever, diphtheria, whooping cough and measles among children up to fifteen shows that nearly 90 percent of the total decline in mortality between 1860 and 1965 had occurred before the introduction of antibiotics and widespread immunization. In part, this recession may be attributed to improved housing and to a decrease in the virulence of micro-organisms, but by far the most important factor was a higher host-resistance due to better nutrition.”
Ivan Illich
Medical Nemesis, Bantam Books, 1977
So, who is right? Here is what official government statistics of infectious disease mortality (number of deaths) show:
———————————
England/Wales: Combined infectious disease mortality rates 1838 – 1980
———————————
United States: Diphtheria mortality rates 1900 – 1966

——————————-
Germany: TB mortality rate 1750 – 1960
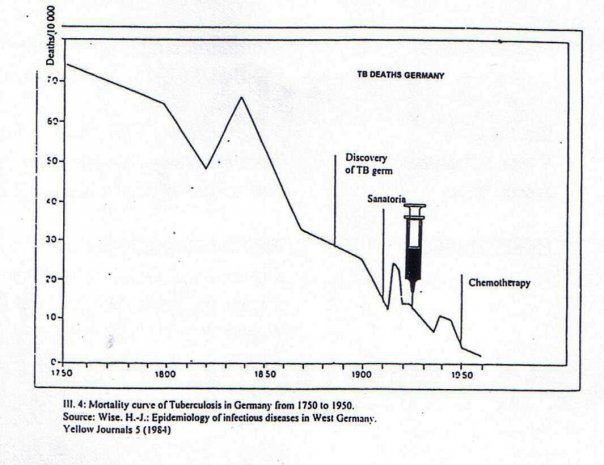
The decline in the number of TB deaths per 10,000 people in Germany from 1750 to 1960. Neither sanatoria nor the TB vaccine nor chemotherapy made any noticeable difference.
Note the spikes during the two world wars (1914 – 1918 and 1939 – 1945), showing that the incidence of TB is related to social and living conditions and that TB and deaths caused by it increase when living conditions deteriorate due to social upheavals, as during the two world wars.
——————————
England: TB mortality rates 1855 – 1965
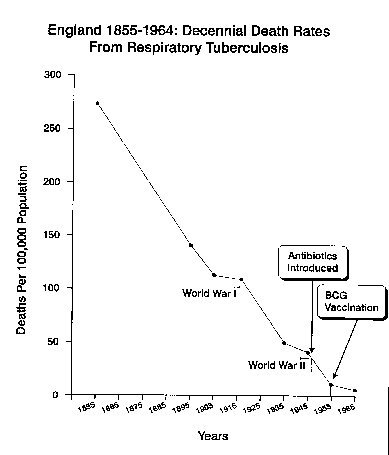
This graph from England shows a similar steep decline in TB mortality and that neither antibiotics nor vaccination contributed to the decline.
Note that unlike in Germany, where TB deaths spiked during the two world wars, in England, the decline only slowed, presumably because in England living conditions didn’t deteriorate as much as in Germany.
——————————-
New Zealand: TB mortality rates 1750 – 1975

Unlike in the two previous graphs, there is no spiking or slowing of TB deaths during the two world wars, as in New Zealand living conditions didn’t change during the war years.
——————————-
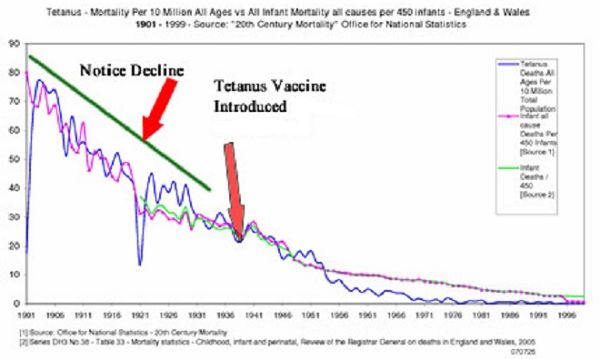
England/Wales: Tetanus mortality rates 1901 – 1966
——————————
England/Wales: Whooping cough mortality rates 1838 – 1976

——————————
US: Whooping cough mortality rates 1900 – 1967

——————————–
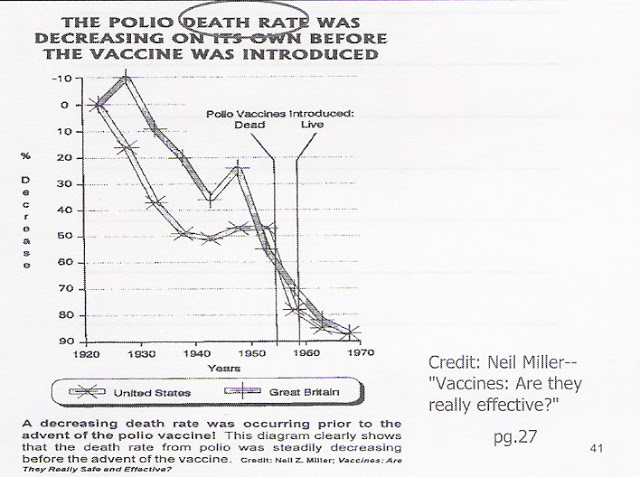
US: Polio mortality rates 1920 – 1970
——————————
US: Measles mortality rates 1900 – 1988

——————————
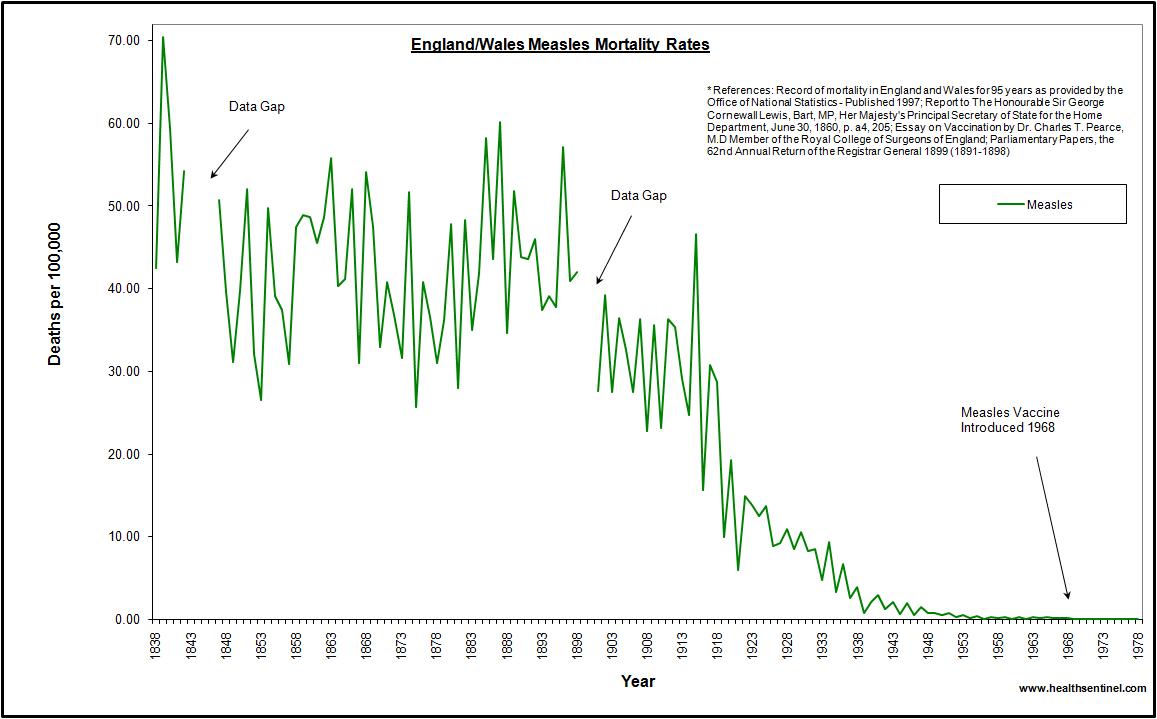
England/Wales: Measles mortality rates 1838 – 1978
——————————
England/Wales: Scarlet fever mortality rates 1838 – 1978

Please note that even though no vaccine was used against scarlet fever, scarlet fever deaths declined similarly to mortality rates of so-called vaccine-preventable diseases.
——————————

“The further I looked into it, the more shocked I became. I found that the whole vaccine business was indeed a gigantic hoax. Most doctors are convinced that they are useful, but if you look at the proper statistics and study the instance of these diseases you will realise that this is not so.”
Dr A Kalokerinos MD, Australia
Quoted from a 1995 interview published in the International Vaccination Newsletter published by Dr Kris Gaublomme MD, Belgium HERE
———————————————
 Quoted from Dr Blaylock’s article HERE
———————————————

“The ‘victory over epidemics’ was not won by medical science or by doctors -and certainly not by vaccines…..the decline…has been the result of technical, social and hygienic improvements and especially of improved nutrition. Here the role of the potato…deserves special mention…..Consider carefully whether you want to let yourself or your children undergo the dangerous, controversial, ineffective and no longer necessary procedure called vaccination, because the claim that vaccinations are the cause for the decline of infectious diseases is utter nonsense.”
Dr med G Buchwald, Germany in ‘The Vaccination Nonsense (2004 Lectures) ISBN 3-8334-2508-3 page 108.
Dr Buchwald pointed out that the medical profession falsely credit vaccinations with the decline of infectious disease mortality and that we owe this decline to innovators like Frederick the Great, to farmers, engineers, architects, town planners, builders and social reformers.
———————————————

In 1756, King Fredrick the Great (1712 – 1786) made the cultivation of the potato, which had been brought from South America to Europe, mandatory in Prussia. SOURCE

By about 1850, over half a century after the king had died, the potato had become the staple food of the lower classes, thereby at long last eliminating the chronic hunger they had suffered and resulting in a significant increase of Germany’s population.

Visitors to King Frederick’s grave at his palace Sans Souci (outside Potsdam, not far from Berlin) still put potatoes on his grave in gratitude for his role in eliminating hunger, which in turn contributed to the decline of infectious disease mortality.
Credits:
– Diphtheria, whooping cough, measles, scarlet fever graphs: Health Sentinel HERE
RELATED
– An Honest Look at the Historical Evidence that Vaccines Eliminated Diseases
– Proof That Vaccines Did Not Save Us, 200 Years Of Official Statistics
http://edgytruth.com/2016/07/05/proof-vaccines-not-save-us-200-years-official-statistics/
– Vaccines: A Peek Underneath the Hood
by Roman Bystrianyk and Suzanne Humphries, MD
International Medical Council on Vaccination
http://www.vaccinationcouncil.org/2013/11/12/vaccines-a-peek-beneath-the-hood-by-roman-bystrianyk-and-suzanne-humphries-md/
——————-
– Dissolving Illusions – Dr Suzanne Humphreys MD & Roman Bystrianyk

——————–
– Immunization Research – Why This Doctor Reversed her Stance on Vaccines – April 8, 2016
http://www.organiclifestylemagazine.com/immunization-research-why-this-doctor-reversed-her-stance-on-vaccines
——————–
The vaccine effort in historical perspective – Australian graphs
https://vaccinationdilemma.com/historical-death-rates-diseases-vaccination-html/


